Prism Signal / PRISM

See the path. Read the pattern.

A proposed visual language for network flows, using labeled bands and wave-like paths to make architectural relationships easier to discuss.

Read the boundaries

Synthetic examples. No live network connection.

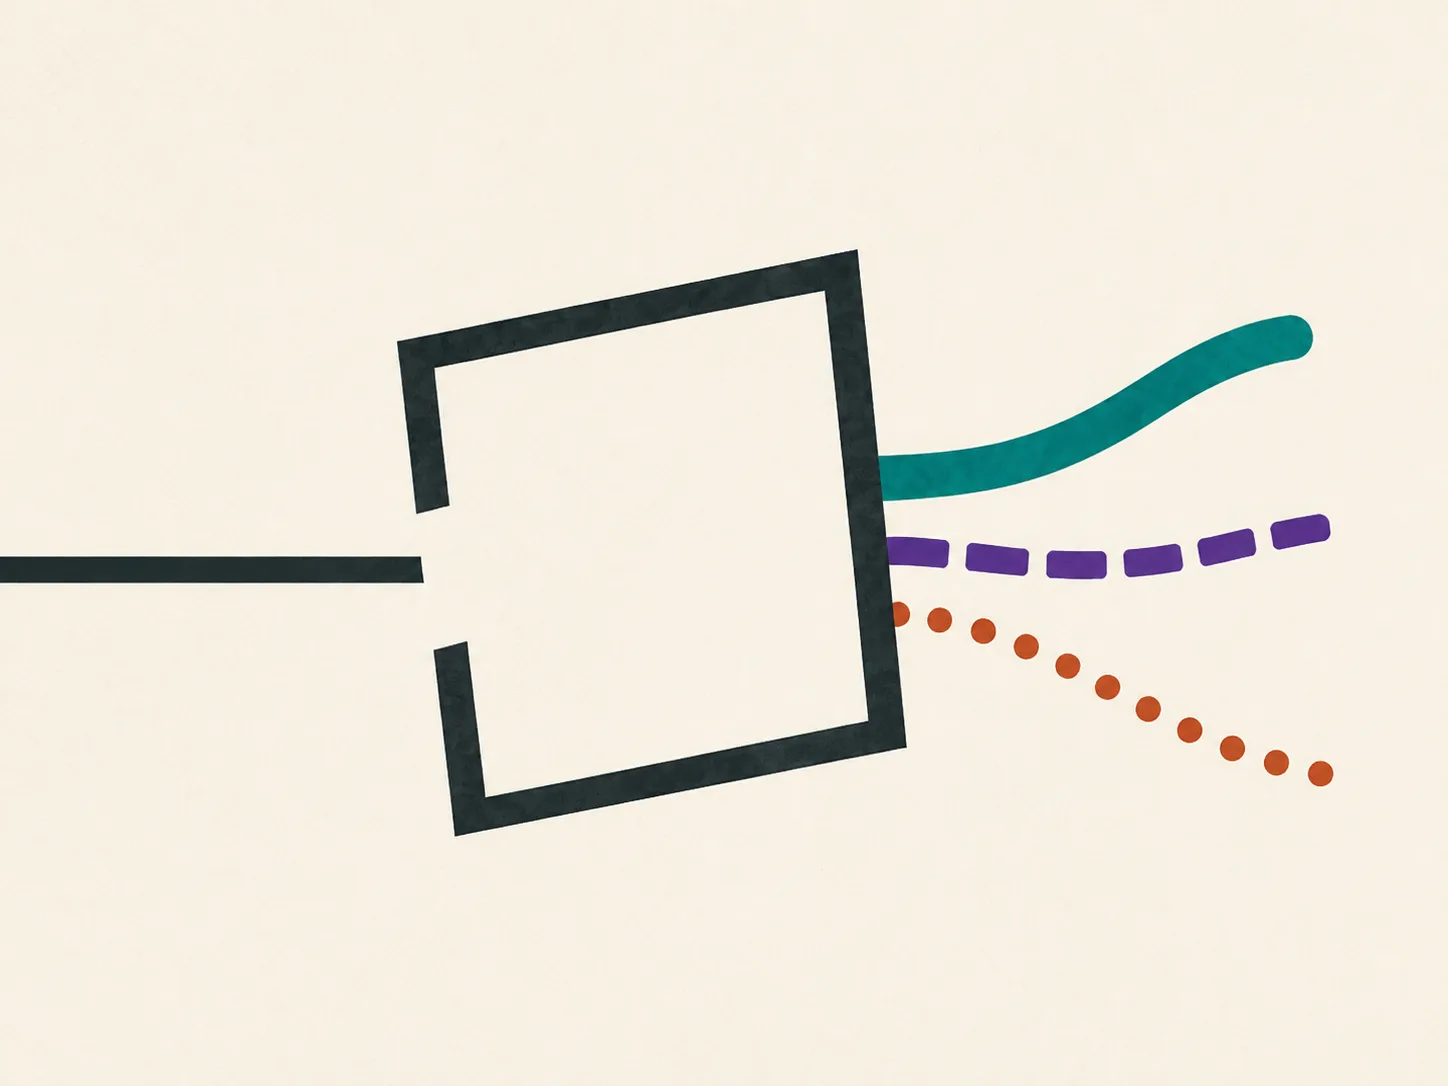
Three colored ribbons pass through a tapered graphite frame with one intentional opening on its left edge.
Concept illustration—not a network measurement.

Network diagrams explain connections, but their movement can still be difficult to discuss. Prism Signal explores a visual grammar in which paths become labeled bands, an authored offset changes a route, and branching becomes a legible fork.

This static concept study presents three handcrafted synthetic schematics. It does not connect to networks, inspect traffic or detect incidents. Its purpose is to make the proposed language understandable—and its boundaries unmistakable.

One path. Three ways to read it.

Synthetic schematic

Choose an authored example—not a diagnostic result.

Baseline — synthetic example

Baseline schematic, horizontal layout Three labeled paths, A, B and C, run in parallel from Input through Relay to Output. Path A is solid, B is dashed and C is dotted. Input Relay Output A B C Baseline schematic, vertical layout Three labeled paths, A, B and C, run in parallel downward from Input through Relay to Output. Path A is solid, B is dashed and C is dotted. Input Relay Output A B C

Three labeled paths pass through Input, Relay and Output. This is an authored reference drawing.

  • Path A — solid
  • Path B — dashed
  • Path C — dotted

Color names a path. Labels and line styles carry the same meaning.

How to read this drawing

Hue names the path; it does not indicate health. Position shows a chosen relationship, not a measured time. A fork represents an authored connection, not an observed event.

A small grammar for complex conversations.

  1. Trace

    Follow a named path from input to output. A label and line style stay with it throughout the drawing.

  2. Compare

    Compare the authored alternatives. An offset or fork is a visual choice, not an inferred diagnosis.

  3. Explain

    Pair every visual change with a sentence describing what was drawn and what remains unknown.

Clear stages. No implied capability.

Everything on this page is a static concept study.

Available on this page

An authored visual identity, three synthetic drawings and a local scenario selector.

Proposed framework

A way to represent network-flow relationships through consistent labels, path geometry and chromatic grouping. No working data integration is demonstrated.

Not established

Live ingestion, incident detection, diagnostic accuracy, performance, security validation or operational readiness.

What would need evaluation

Whether people interpret the drawings consistently, whether the visual grammar remains accessible, and whether any future implementation can represent data faithfully. These are open questions, not delivery commitments.